How To Visualize CSV Data With Kibana
Introduction:
When you’re analyzing large sets of data, it can be challenging to present your results in a way that’s both meaningful and easy to understand. Data visualization can solve this problem by rendering data in various graphic formats, such as charts, graphs and diagrams. Fortunately, you can easily create these charts and graphs in Kibana, a visual interface for Elasticsearch that can be accessed in a browser. In this step-by-step tutorial, we’ll explain how to visualize CSV data with Kibana.
Prerequisites:
Before we attempt to visualize CSV data with Kibana, it’s important to make sure certain prerequisites are in place. For this task, there are a few key system requirements:
Java and JDK 8 must be installed and properly configured beforehand, and the
JAVA_HOMEenvironment variable must point to the version of Java running JDK 8.You’ll need an Elasticsearch index created, which is where you’ll push uploaded CSV data.
You’ll also need to have a CSV file handy with some data you’d like to visualize; otherwise, you can use this sample data set of automobile classifieds to get started. Kibana does not allow CSV files larger than 100MB, so you may need to trim your dataset down, or divide the dataset into multiple uploads.
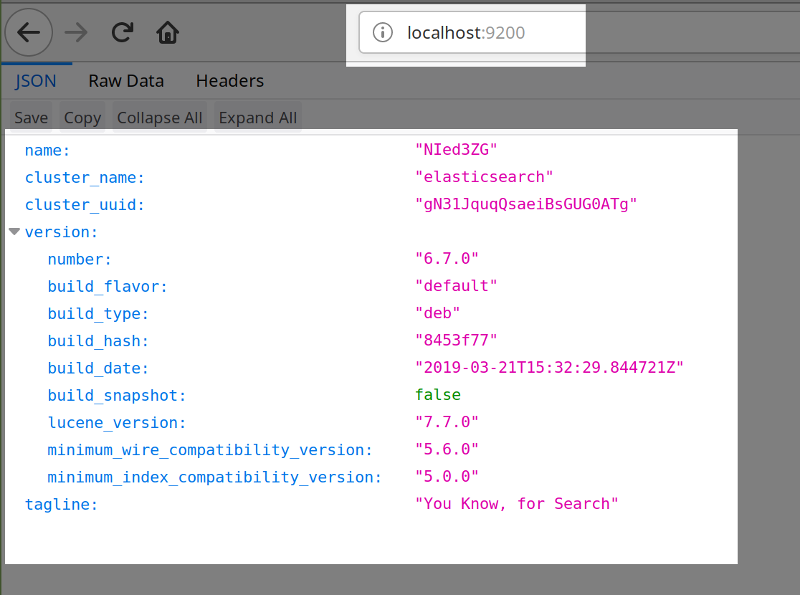
The Elastic Stack (specifically Elasticsearch and Kibana) need to be installed and running. Navigate to
localhost:9200(or your server’s domain and the port that Elasticsearch is running on) to confirm that the service is running. You should see a JSON response from the Elasticsearch cluster upon page load:
- In the same manner that you received a JSON response from Elasticsearch in your browser, you can also access the Kibana UI by navigating to port
5601on your server. If you receive a “404 Not Found” response or no response at all, then the Kibana service might not be running.
Start the Kibana service:
Once you’ve confirmed all your system requirements are in place, you can start up the Kibana service:
- If Kibana was installed on macOS using Homebrew, you can use this command:
1 | brew services start kibana |
In Linux, you can just use the
servicecommand:`bash sudo service kibana start`To run Kibana as a service without actually installing it, simply navigate to the
bindirectory and executeKibana:
1 | bin/Kibana |
Import CSV using Kibana
Next, we’ll upload some CSV data using Kibana. Let’s walk through the steps we’ll need to take to accomplish that task.
Open up the Kibana UI and get started:
Navigate to port 5601 (or whichever port on your server Kibana has been configured to run on) if you haven’t already to access the interface. At this point you should see the Kibana GUI; it will ask if you want to use their own test data if you’re running it for the first time.
Exploring the Kibana UI:
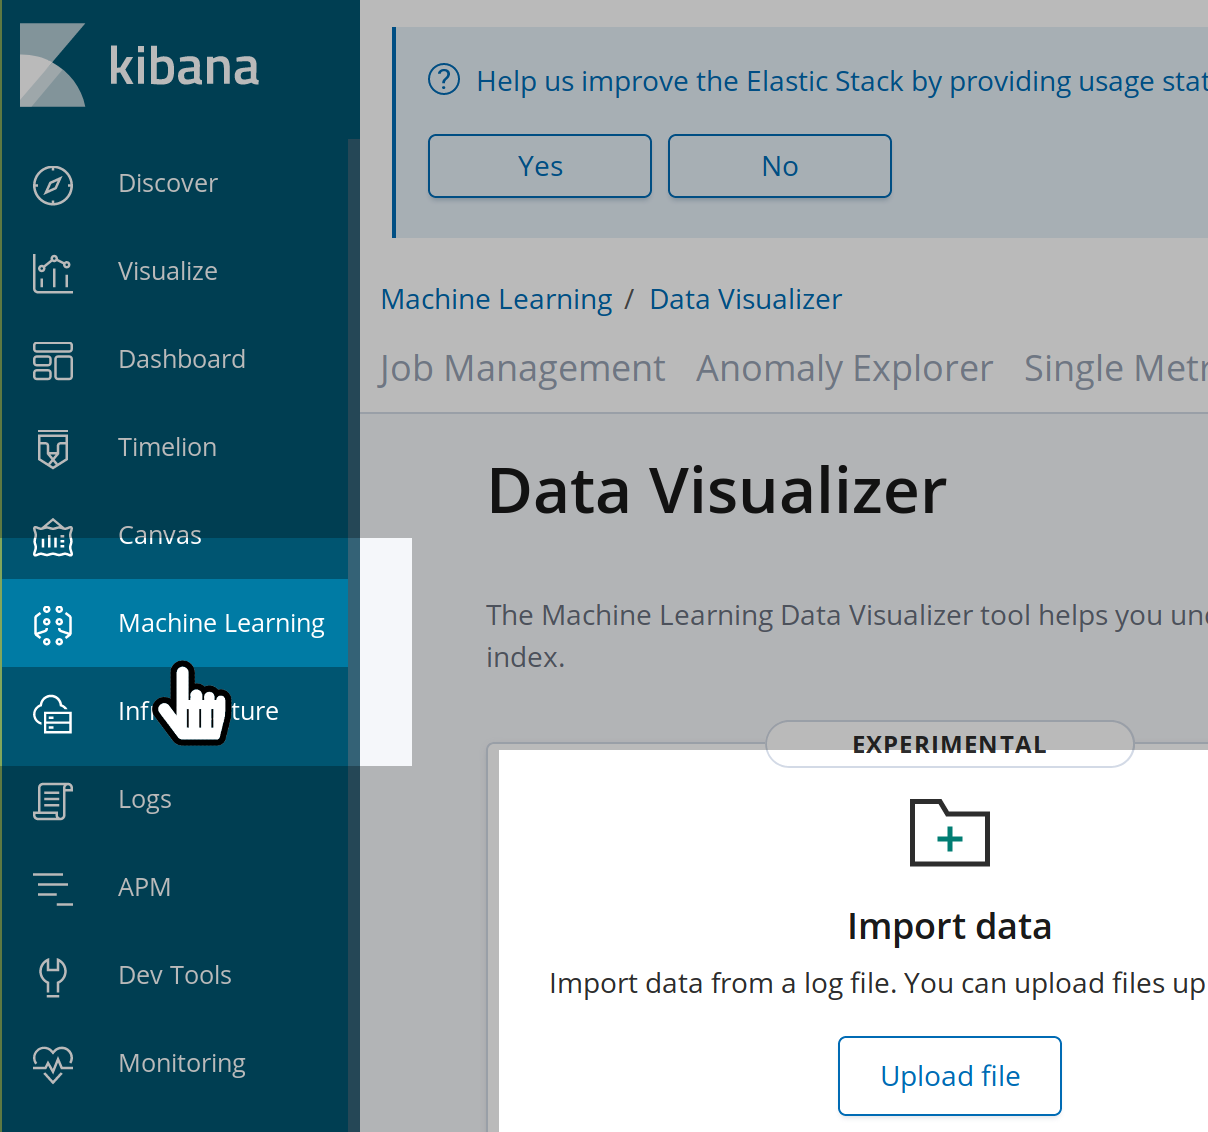
Click on the “Machine Learning” tab on the left side of the interface. This is where you’ll go to load and analyze data in Kibana.
Uploading CSV data:
Import the CSV file
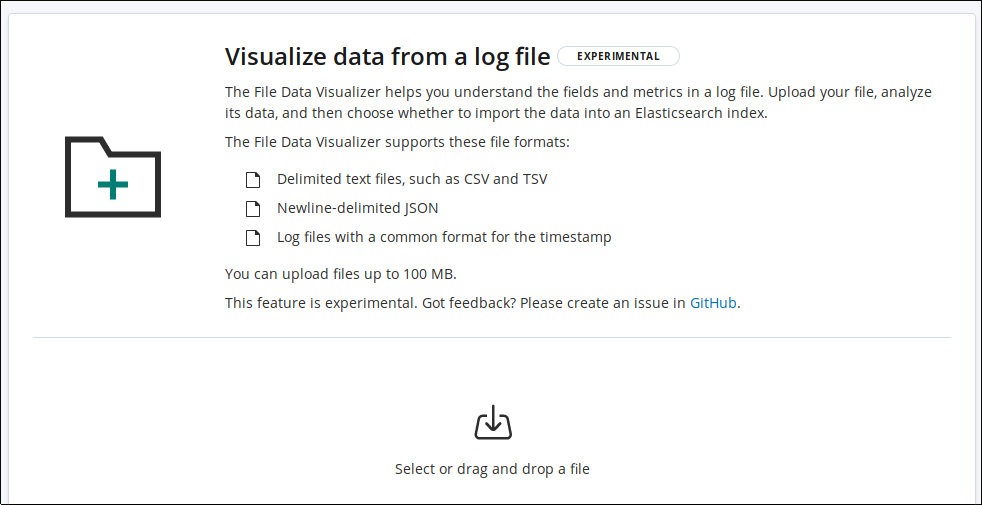
Click the “Upload File” button, or drag and drop a file, in the “Data Visualizer” section and upload the CSV file containing your data:
Drag-and-drop data into Kibana:
 ](https://gyazo.com/a54f05c721d0602ea7d980a72586f010)
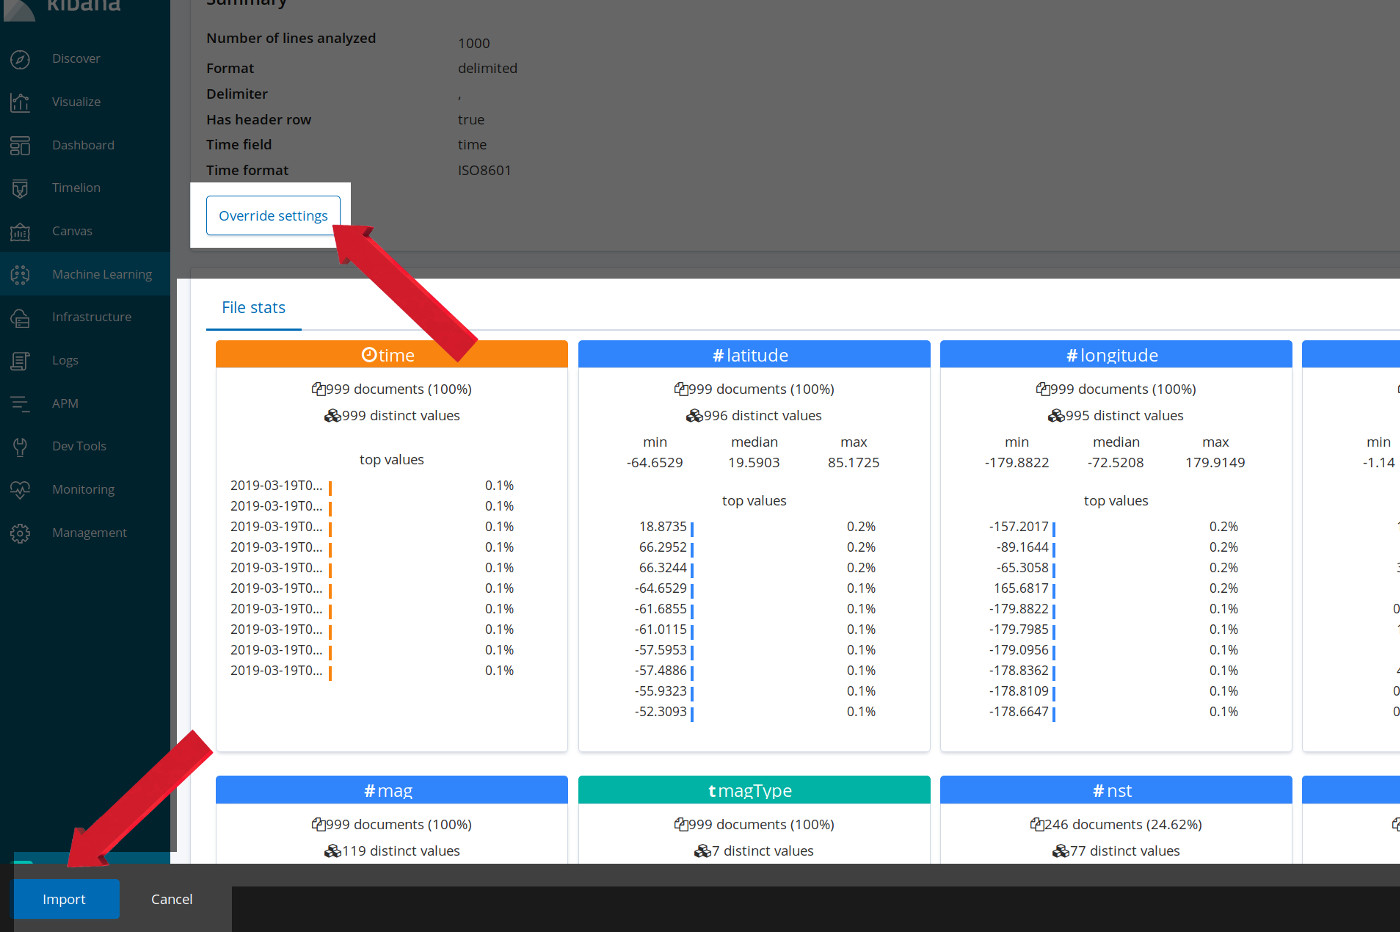
A summary of the file contents after uploading a CSV file into Kibana:
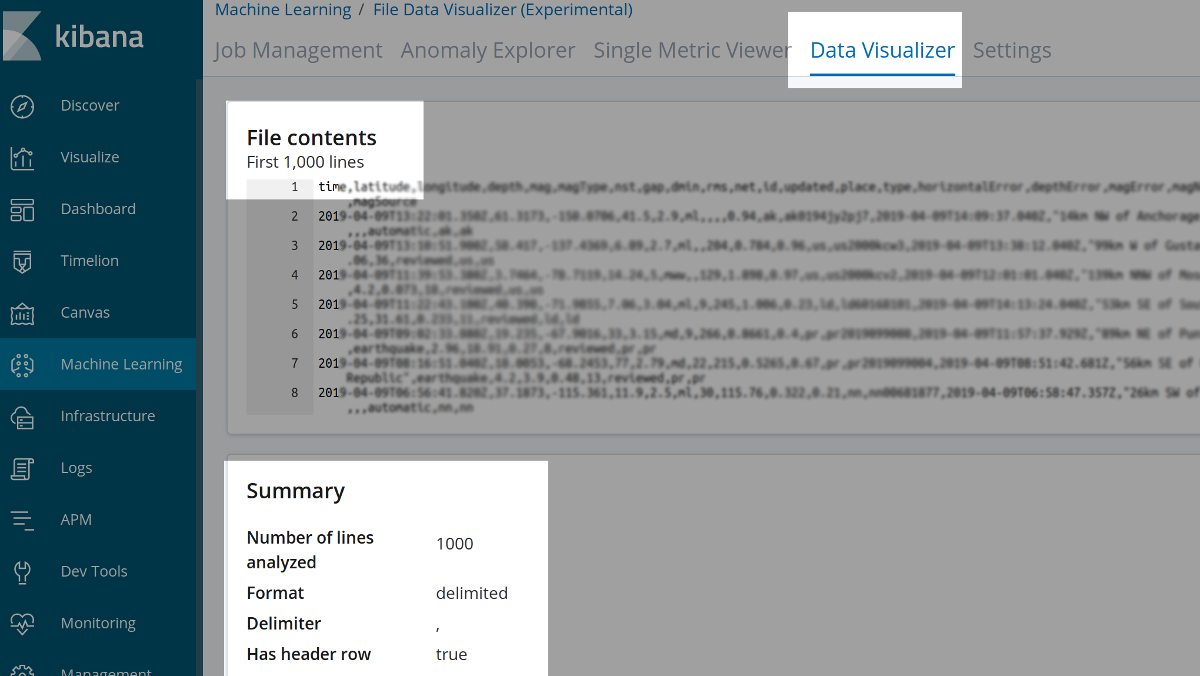
After your file upload is complete, the File Contents Summary should display the CSV data. If you scroll down further, you can look at how Elasticsearch interpreted the various fields and data types from your data set.
- The “Override Settings” button opens up a panel that allows you to adjust the fields and modify how the data in your CSV index is mapped. You can also change the delimiter used for the CSV data.
- The button to finalize the import and put the data into an index is located near the bottom left-hand corner of the Kibana interface. Click this after you’re done adjusting the fields, the mappings and any other settings.
Click the Import button to import the CSV data into an Elasticsearch index:
Choose an index name for the imported data:
At this point, you’ll need to select an index name for the data you imported. Keep in mind that Elasticsearch index names must be lowercase:
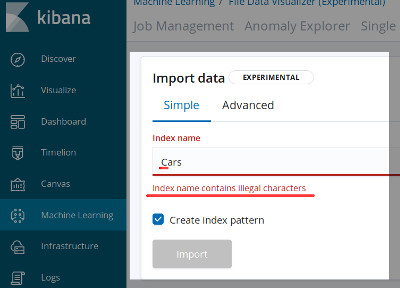
Enter a valid Elasticsearch index name, containing no illegal characters or uppercase letters, and click “Import”.
Use the Kibana Console to verify that the data was indexed
You can confirm that your CSV data was successfully indexed by making a GET request in Kibana’s Console UI. Just click on “Dev Tools” and make a GET request in the Kibana Console:
1 | GET /classifieds/_count |
This should return a JSON response shown in the right panel:
1 2 3 4 5 6 7 8 9 | { "count" : 3876, "_shards" : { "total" : 1, "successful" : 1, "skipped" : 0, "failed" : 0 } } |
If the "count" field’s integer in the JSON response is equal to the number of rows in your CSV file, then you can confirm that all of the CSV data was indexed properly.
Kibana Visualization
At this point, we’re ready to create some charts and graphs in Kibana. Kibana’s Visualize page allows you to see your data in different graphical formats. Each chart and graph can be saved or gathered together to create a dashboard.
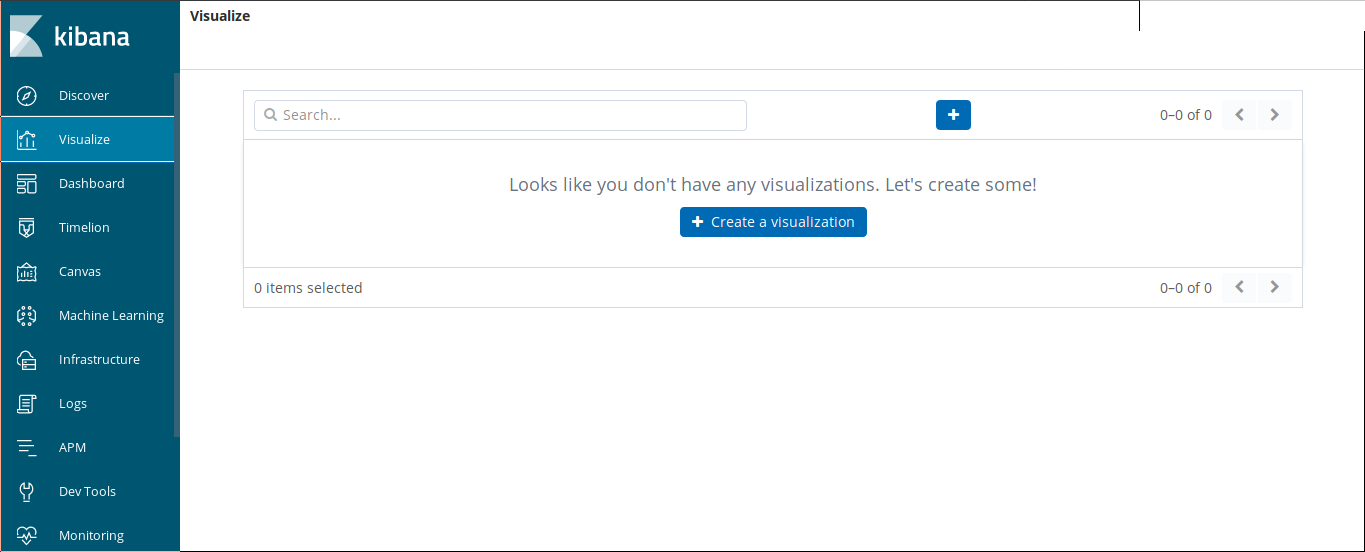
Click Visualize on the left-side pane of the Kibana interface to enter the “Visualizations” section of Kibana, and then click the “Create a Visualization” button to begin.
Create a visualization in Kibana:
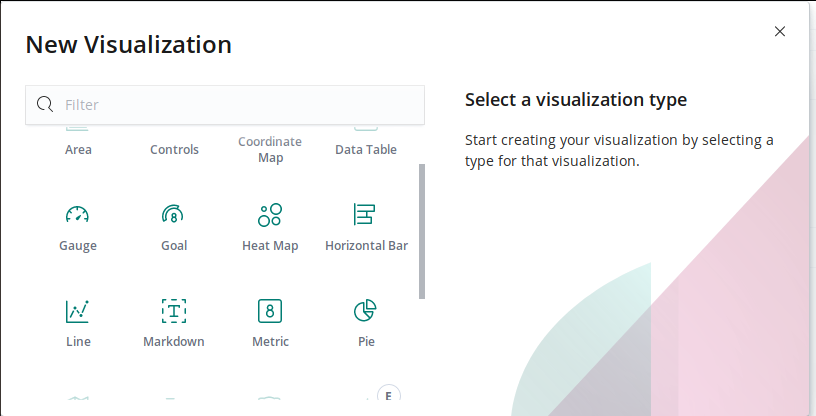
For this example, let’s try creating a pie chart. Click the Pie visualizer in the Basic Charts category.
Select from many Visualization types:
Next, select the name of the index you’d like to visualize, and you’ll see a large, circular graph representing the data stored in that index:
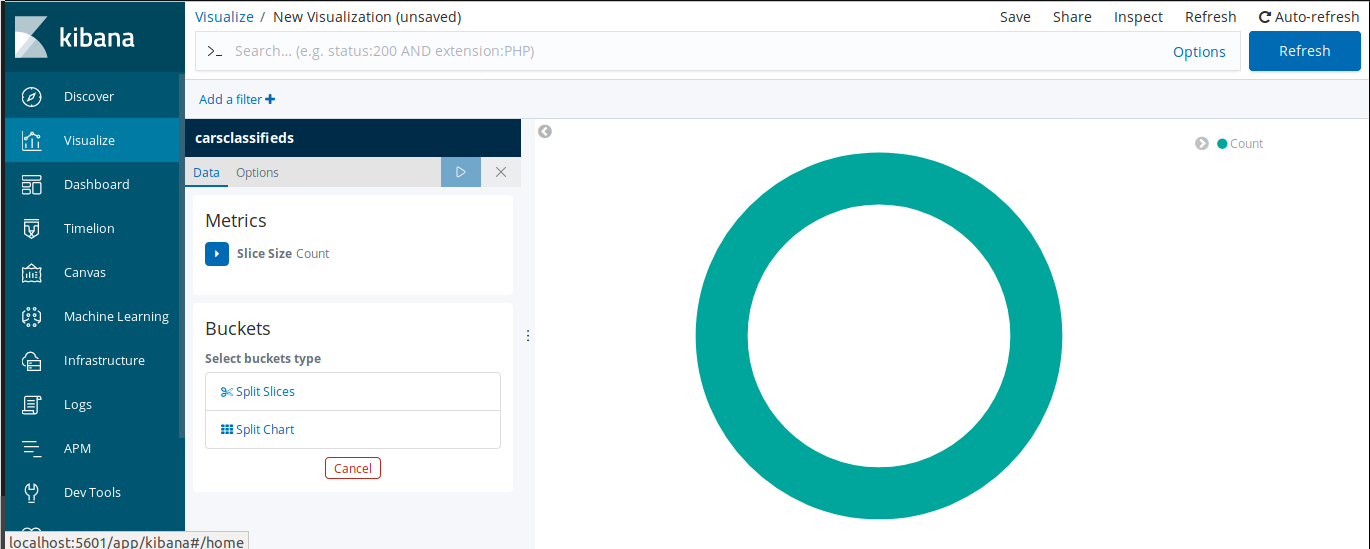
This is a good start, but we can make this presentation more meaningful. Let’s select the “Split Slices option” to be able to add an aggregation.
Split Splices and Buckets:
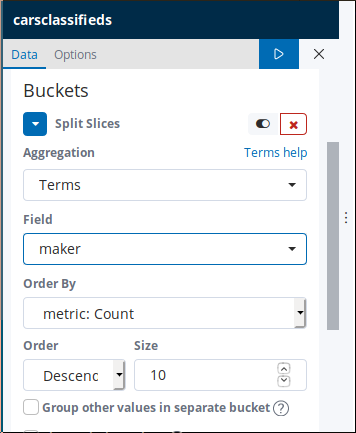
These Sub-Buckets are used to to set up aggregations for pie charts in Kibana. The Split Splices can then be used to pick the Sub-Buckets. You can adjust the settings to get a better feel for how the different aggregations work. Just click the blue arrow to change the settings for the graphs and visualizations.
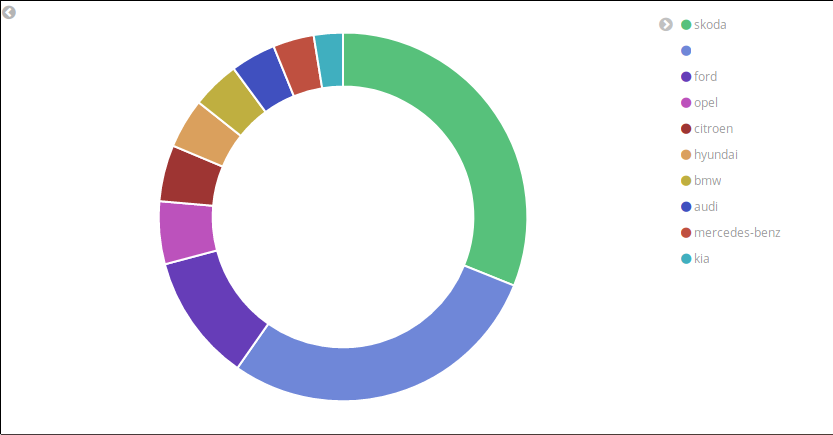
A circular graph representing the CSV data in an Elasticsearch index:
Conclusion:
It’s true that a picture is worth a thousand words, and there’s no doubt that data visualization techniques can help you present your data in clearer, more meaningful ways. With the step-by-step instructions included in this article, you can harness the power of the Elastic stack to index your data in Elasticsearch and then visualize CSV data in Kibana.


Pilot the ObjectRocket Platform Free!
Try Fully-Managed CockroachDB, Elasticsearch, MongoDB, PostgreSQL (Beta) or Redis.
Get Started