How to Use the Cluster API in the Elasticsearch Python Client Library
Introduction
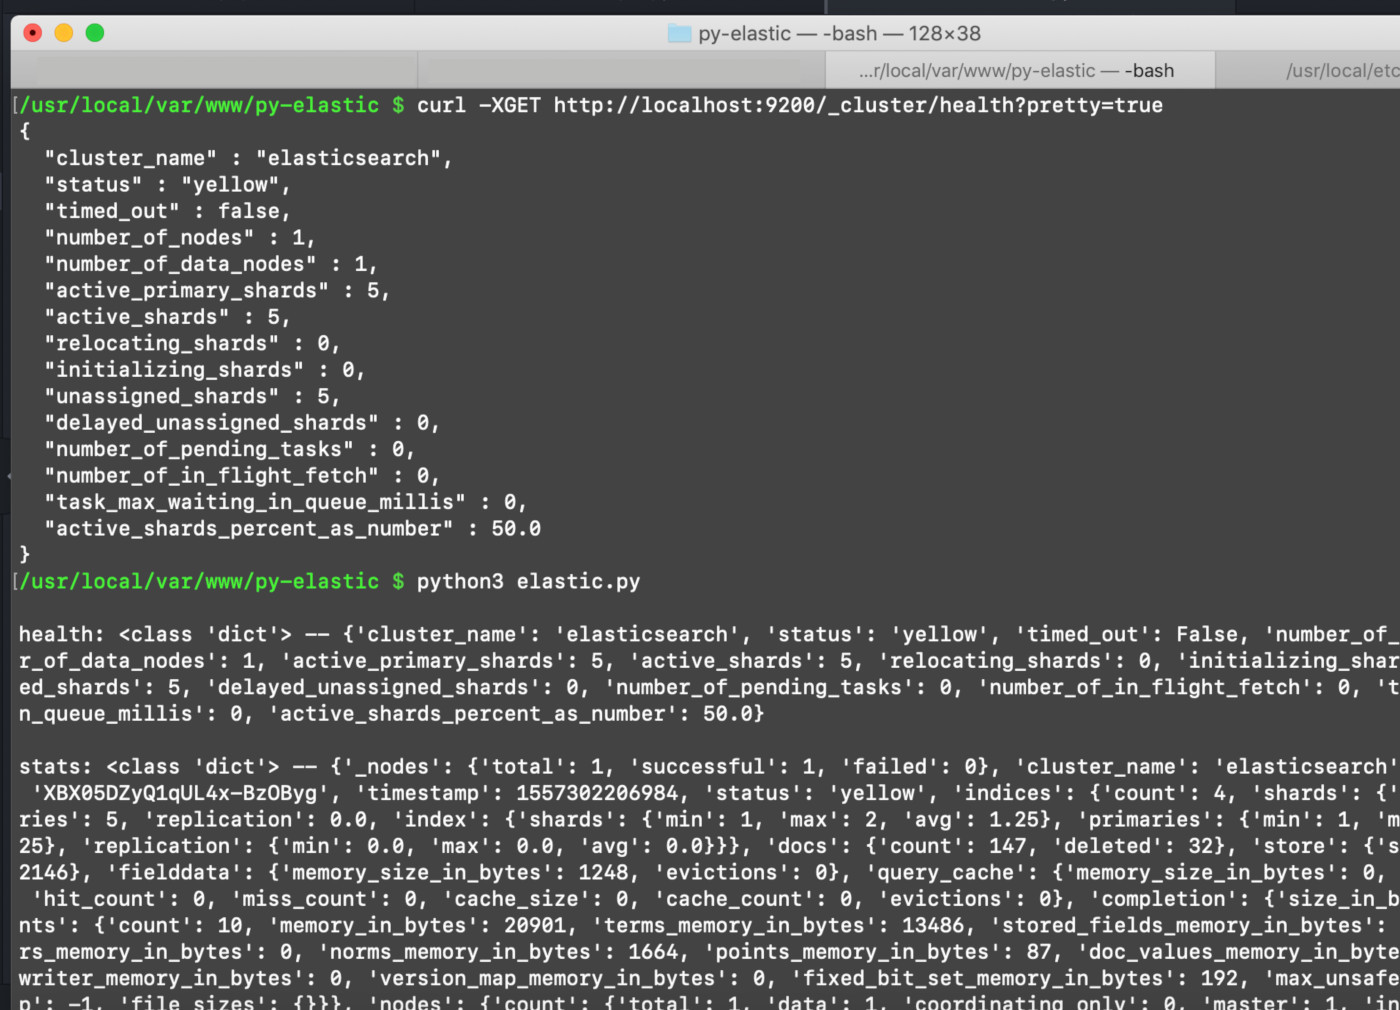
If you’ve been working with Elasticsearch, you may have issued a few cURL requests to communicate with the service and get information about your cluster. For example, a simple GET request using cURL will return data on an Elasticsearch cluster’s health:
1 2 3 4 5 | # get Elasticsearch cluster health curl -XGET "http://localhost:9200/_cluster/health?pretty=true" # get Elasticsearch cluster stats curl -XGET "http://localhost:9200/_cluster/stats?pretty=true" |
Not all of these requests need to be made using cURL– you can get the same data and parse through it using a Python script. All it takes is a bit of simple code to use Python for Elasticsearch cluster health information and much more. In this article, we’ll explain how to use Python for Elasticsearch cluster stats and other important information.
Prerequisites
Before we look at any Python code, it’s important to ensure certain system requirements are met. For this task, there are only a couple of prerequisites:
You’ll need to have an Elasticsearch cluster running on your server, and the Python low-level client needs to be installed. You can use PIP to install the library:
pip3 install elasticsearch.The following cURL request can be used to check if an Elasticsearch cluster is running on the default port of
9200:
1 | curl -XGET localhost:9200 |
- In this tutorial, the examples shown will assume that Elasticsearch is using port
9200on a localhost server and that the Python commands are run in Python version 3.
Get the attributes of the Elasticsearch client’s Cluster class in Python
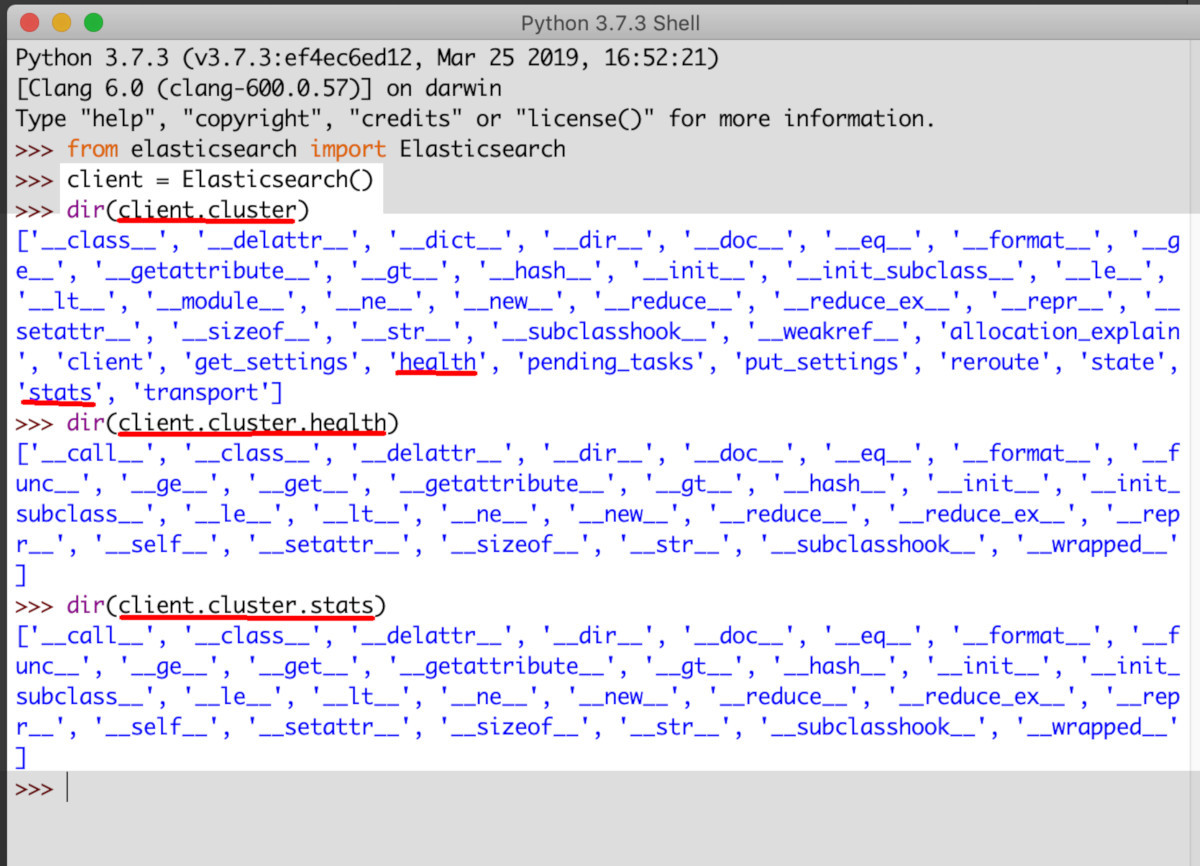
In Python, virtually everything is an “object”, including variables and strings. This means that they all have classes, attributes and methods. Knowing this, we can use the dir() function to return all the attributes for the Elasticsearch client’s Cluster class in a Python list.
To do this, open a Python interpreter like IDLE, and use the following code to get all the attributes the Elasticsearch client’s Cluster:
1 2 3 4 5 | from elasticsearch import Elasticsearch client = Elasticsearch() dir(client.cluster) dir(client.cluster.health) dir(client.cluster.stats) |
Using dir() to return a list of the Elasticsearch cluster’s attributes:

Import Elasticsearch in a Python script and access the Cluster class
Next, we’ll create a new Python script (using the file extension: .py) and import the Elasticsearch low-level client at the beginning of the script:
1 2 3 4 5 | #!/usr/bin/env python3 #-*- coding: utf-8 -*- # create a client instance of the library elastic_client = Elasticsearch() |
After you create the client instance, its cluster class becomes accessible to Python. This makes it possible to use Python for Elasticsearch cluster health info, and also to use Python for Elasticsearch cluster stats info. In the code below, we use Python’s print() function to print out the health and stats methods by calling them inside of the print parentheses:
1 2 | print ("nhealth:", type(health), '--', health) print ("nstats:", type(stats), '--', stats) |
Python printing out information about the Elasticsearch client’s cluster.health() and cluster.stats() methods:

The call returns a dictionary, which looks like a large block of text. We’ll store those dictionaries in variables to parse through and use later on:
1 2 | health = elastic_client.cluster.health() stats = elastic_client.cluster.stats() |
Iterate over a Python dictionary of Elasticsearch cluster information
The Cluster class has too many attributes to cover in this tutorial, but parsing a few examples will get you off to a good start.
Iterate over the Python dictionary returned by the cluster.health() method:
Let’s start by parsing the dictionary returned by the cluster.health() method. We’ll use the items() method to iterate the key-value pairs of the cluster.health dictionary returned by Python 3:
1 2 3 | print ('elasticsearch cluster:', health['cluster_name']) for key, value in health.items(): print ('key:', key, '-- value:', value) |
The iterator should return something like this:
1 2 3 4 5 6 7 8 9 10 11 12 13 14 15 16 | elasticsearch cluster: elasticsearch key: cluster_name -- value: elasticsearch key: status -- value: yellow key: timed_out -- value: False key: number_of_nodes -- value: 1 key: number_of_data_nodes -- value: 1 key: active_primary_shards -- value: 5 key: active_shards -- value: 5 key: relocating_shards -- value: 0 key: initializing_shards -- value: 0 key: unassigned_shards -- value: 5 key: delayed_unassigned_shards -- value: 0 key: number_of_pending_tasks -- value: 0 key: number_of_in_flight_fetch -- value: 0 key: task_max_waiting_in_queue_millis -- value: 0 key: active_shards_percent_as_number -- value: 50.0 |
NOTE: If you’re using Python 2, use .iteritems() to iterate over the key-value pairs of a dictionary instead of .items().
The same process can be done for the cluster.stats dictionary as well, but keep in mind that the stats() method returns a dictionary with other dictionaries nested inside it.
You can use the following code to parse out the 'indices' key from the large amount of information returned by stats:
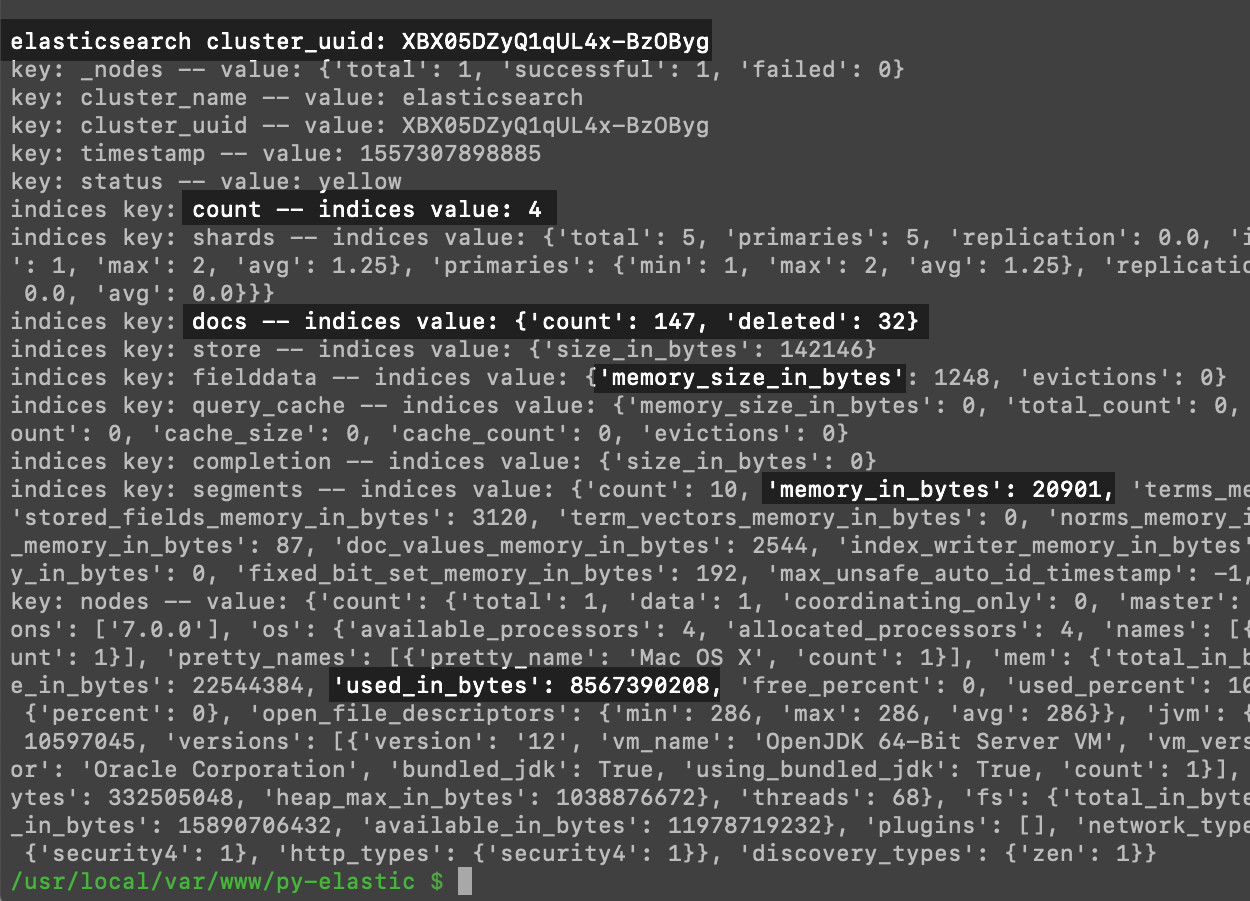
1 2 3 4 5 6 7 8 9 10 | print ('nelasticsearch cluster_uuid:', stats['cluster_uuid']) for key, value in stats.items(): # if the key is not 'indices' then just print it out if key != "indices": print ('key:', key, '-- value:', value) # iterate the key-value pair for indices else: for index_key, index_value in stats['indices'].items(): print ('indices key:', index_key, '-- indices value:', index_value) |
The cluster.stats() method returns a wealth of useful information about an Elasticsearch cluster’s indices and documents:

As you can see, parsing the dictionary returned by the cluster.stats() method is a great way to quickly get information about an Elasticsearch cluster and its indices.
How to monitor the Elasticsearch cluster stats in Python
The Cluster class of the Elasticsearch Python client is a valuable tool to use in backend web applications that need to continuously monitor the health and status of an Elasticsearch cluster. In these types of applications, the script usually gets called at regular intervals, and the values are stored in a serialized “pickle” object to check for changes.
Select just a few of the cluster stats to monitor
It would require too much overhead and hard drive space to save every key in the dictionaries returned by the Cluster API. Instead, it’s better to just choose a few vital stats that you’d like to monitor:
1 2 3 4 5 6 7 8 9 10 11 12 13 14 15 16 17 | # cluster.health() health_status = health['status'] health_reloc_shards = health['relocating_shards'] # cluster.stats()['indices']['docs']: docs_count = stats['indices']['docs']['count'] docs_count = stats['indices']['docs']['deleted'] nodes_mem_used = stats['nodes']['os']['mem']['used_percent'] # cluster.stats()['nodes']['jvm']: jvm_mem_used = stats['nodes']['jvm']['mem']['heap_used_in_bytes'] jvm_mem_max = stats['nodes']['jvm']['mem']['heap_max_in_bytes'] nodes_mem_free = stats['nodes']['os']['mem']['free_percent'] jvm_mem_percent_free = 100 - ((jvm_mem_used / jvm_mem_max)*100) print ("Cluster health status:", health_status) print ("JVM memory free:", jvm_mem_percent_free, "%") |
Store the Cluster stats in a serialized Python object
Next, we’ll use Python’s Pickle library to store the cluster stats. The try exception block shown below will attempt to load serialized cluster stats data if such data exists, or it will create a new dictionary if the script hasn’t gathered any data yet:
1 2 3 4 5 6 7 8 9 10 11 12 13 14 15 16 17 18 | import pickle try: stats_to_save = pickle.load(open("elasticsearch_stats.pickle", "rb")) except (IOError, OSError) as error: print ("Elasticsearch cluster serialization error:", error) # create a new dictionary if there is none saved print ("Creating new stats dictionary") stats_to_save = {} ''' *********************************** PUT NEW STATS INTO DICTIONARY HERE IF CERTAIN CONDITIONS ARE MET *********************************** ''' # save the data pickle.dump(stats_to_save, open("elasticsearch_stats.pickle", "wb")) |
The most efficient way to store this data is to create a new dictionary and use timestamps as its keys. This enables you to to store the stats for a certain point in time as the value of each key.
Get the latest timestamp of the collected cluster stats data
Python dictionaries are structured as an unordered collection of data, so to get the latest timestamp of the cluster stats you’ll either have to use the OrderedDict Python library or create a function to get the latest timestamp. In our example below, we created the get_last_timestamp function:
1 2 3 4 5 6 7 8 9 10 11 12 13 14 15 16 17 18 19 | import time # get the latest timestamp key def get_last_timestamp(_dict): latest = 0 for ts, value in _dict.items(): if ts > latest: latest = ts return latest # time() represents seconds since epoch five_minutes_ago = time.time() - (60*5) # only make the API call if it's been at least 5 minutes if latest < five_minutes_ago: ''' <------------ DO STUFF HERE -----> ''' pass |
The code shown above will only make an API call if at least five minutes have elapsed since the last cluster stats and health call.
Conclusion
Python is an excellent language to use for scripts that get information about an Elasticsearch cluster. With Python, it’s easy to parse through strings inside of the dictionaries and lists returned by the Elasticsearch cluster. You can then visualize the data you received from the Elasticsearch client using graphs and charts, and you’ll be able to make informed calculations about your cluster’s health and performance based on the data collected from the Cluster API. Armed with the examples and instructions provided in this article, you’ll be ready to write code using the Cluster API in the Elasticsearch Python client library.
In our tutorial, we examined the Python code one segment at a time. Here’s the complete script that will return cluster stats data and serialize it for record keeping. If you’re worried about the serialized dictionary getting too big, you can simply write a function that deletes any timestamp keys older than a day or so. This function would use the dictionary’s built-in .pop() method (e.g. stats_to_save.pop(1234567)):
1 2 3 4 5 6 7 8 9 10 11 12 13 14 15 16 17 18 19 20 21 22 23 24 25 26 27 28 29 30 31 32 33 34 35 36 37 38 39 40 41 42 43 44 45 46 47 48 49 50 51 52 53 54 55 56 57 58 59 60 61 62 63 64 65 66 67 68 69 70 71 72 73 74 75 | #!/usr/bin/env python3 #-*- coding: utf-8 -*- # create a client instance of the library elastic_client = Elasticsearch() # function to get the latest timestamp key def get_last_timestamp(_dict): latest = 0 for ts, value in _dict.items(): if ts > latest: latest = ts return latest # try to load the old data, or just create a new dictionary # if the file doesn't exist try: stats_to_save = pickle.load(open("elasticsearch_stats.pickle", "rb")) except (IOError, OSError) as error: print ("Elasticsearch cluster serialization error:", error) # create a new dictionary if there is none saved print ("Creating new stats dictionary") stats_to_save = {} # get the timestamp for the last entry latest = get_last_timestamp(stats_to_save) # time() represents seconds since epoch five_minutes_ago = time.time() - (5) if len(stats_to_save) == 0 or latest < five_minutes_ago: # make the API calls to the Cluster() class health = elastic_client.cluster.health() stats = elastic_client.cluster.stats() #print ("nhealth:", type(health), '--', health) #print ("nstats:", type(stats), '--', stats) # cluster.health() health_status = health['status'] health_reloc_shards = health['relocating_shards'] # cluster.stats()['indices']['docs']: docs_count = stats['indices']['docs']['count'] docs_count = stats['indices']['docs']['deleted'] nodes_mem_used = stats['nodes']['os']['mem']['used_percent'] # cluster.stats()['nodes']['jvm']: jvm_mem_used = stats['nodes']['jvm']['mem']['heap_used_in_bytes'] jvm_mem_max = stats['nodes']['jvm']['mem']['heap_max_in_bytes'] nodes_mem_free = stats['nodes']['os']['mem']['free_percent'] jvm_mem_percent_free = 100 - ((jvm_mem_used / jvm_mem_max)*100) print ("Cluster health status:", health_status) print ("JVM memory free:", jvm_mem_percent_free, "%") # store the new variables with a timestamp integer for a key new_timestamp = int(time.time()) # create nested dictionary inside it for the timestamp's values stats_to_save[new_timestamp] = {} stats_to_save[new_timestamp]['health_status'] = health['status'] stats_to_save[new_timestamp]['health_reloc_shards'] = health['relocating_shards'] stats_to_save[new_timestamp]['docs_count'] = stats['indices']['docs']['count'] stats_to_save[new_timestamp]['docs_count'] = stats['indices']['docs']['deleted'] stats_to_save[new_timestamp]['nodes_mem_used'] = stats['nodes']['os']['mem']['used_percent'] stats_to_save[new_timestamp]['jvm_mem_used'] = stats['nodes']['jvm']['mem']['heap_used_in_bytes'] stats_to_save[new_timestamp]['jvm_mem_max'] = stats['nodes']['jvm']['mem']['heap_max_in_bytes'] stats_to_save[new_timestamp]['nodes_mem_free'] = stats['nodes']['os']['mem']['free_percent'] # save the data pickle.dump(stats_to_save, open("elasticsearch_stats.pickle", "wb")) #print (stats_to_save[new_timestamp]) |
Pilot the ObjectRocket Platform Free!
Try Fully-Managed CockroachDB, Elasticsearch, MongoDB, PostgreSQL (Beta) or Redis.
Get Started


