Guide On How To Define A Kibana Index Pattern
Introduction
To get the most out of the capability of the Elasticsearch service, it is best to install the entire Elastic Stack. This includes the user interface tool called Kibana, which brings the features onto the screen in a friendly layout. To establish the display options ability to access the data index patterns must be set up. Follow the tutorial that follows to set all ranges for variables that will deliver the data from their designated sources to be fed into Kibana graphics.
Before building visualizations in Kibana, the index pattern needs to be set up for all potential indices in the application. The index names can be generated dynamically. There will be one index per day, but it needs to be possible to create dashboards and visualizations to function across multiple indices when they exist.
Prerequisites
- The complete ELK stack—Elasticsearch, Logstash, and Kibana—needs to be installed on the machine or server that will be used with these procedures.
Elasticsearch is only set up to support 64-bit architecture. Many, if not all of, the Elastic products will have trouble working properly on a 32-bit environment.
It is recommended that the user install the same “major” version of Kibana that matches the major version number of the Elasticsearch installation currently being run (e.g. Only Kibana v5.x should be installed alongside Elasticsearch v5.x). Consult Elastic’s support compatibility matrix for more information.
- It is also recommended to have Java series 1.8, or later, installed when running Elasticsearch. For more information, or to check the version of Java installed, visit the Java Panel found in the System Menu.
Define An Index Pattern
- To access the Kibana UI, the user needs to open a browser of their choice and point it at port
5601by typing the code found below.1localhost:5601 or http://YOURDOMAIN.com:5601. - Log in to the Kibana user interface.
- Click Management and then select Index Patterns from the open menu. Kibana will then display the Create Index Pattern page.

In the “Step 1 of 2: Define index pattern” area, complete the following steps as listed:
In the “Index pattern” field, enter the name of the index for which an index pattern is to be created. For the purpose of the example detailed here, the name `shakes will be used. ba`, if there are no other settings to configure for this additional pattern.
Create the index pattern for the Logstash dataset. This set is for time-series data.
* Kibana displays the list of indices for which logs are available. In this case, Kibana also provides notification for success in matching the correct pattern ("__Success!__ Your index pattern matches __1 index__").
* The _Next step_ button will become available when the specified index name matches with an item in the previously mentioned indices list.
* Click Next step to continue this process.
* In the _Configure Settings_ tab, click on _Create Index Pattern_.
* To define another index pattern that is exactly the same enter the phrase
- Define an index pattern named
logstash*. - Click on the Next step button.
- In Configure settings, select
@timestampin the Time Filter fieldnamedropdown menu. - Click on Create Index Pattern.
Creating an Index Pattern to Connect to Elasticsearch
In the Kibana UI, after selecting the Management tab, click Index Patterns. The Index Patterns tab is then displayed on the screen.
Click on Add New. The pattern section that allows the user to configure an index will be displayed next.
Specify the index pattern to match the name of one or more Elasticsearch indices. Kibana will assume it is working with log data fed to Elasticsearch from Logstash, by default, so it will propose “
logstash-*” to manage this kind of data.If the index does not have the data time-based, select the option “I don’t want to use the Time Filter” button.
Enter the name of the pattern or just use
name, which is the presetdefault*.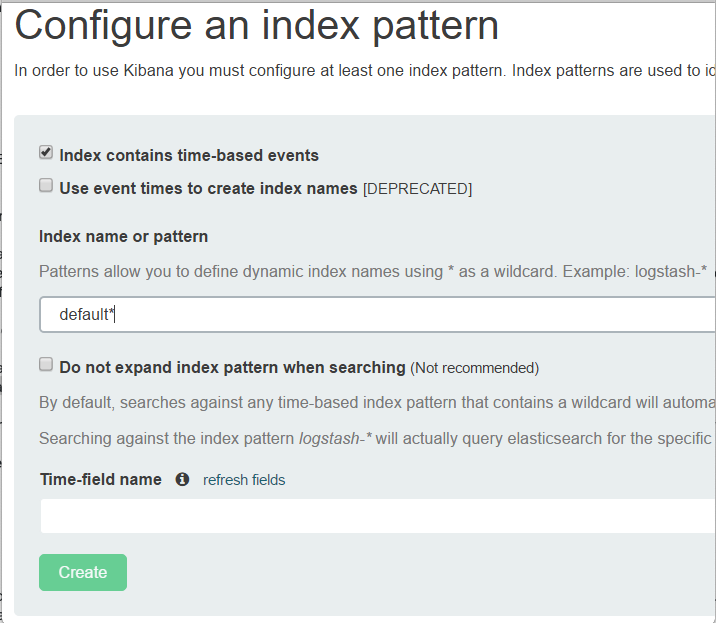
Be sure the Do not expand index pattern when searching option is not selected. Kibana will limit the wildcard expansion of data when it is within the selected range for time-based indices patterns, by default.
Set
@timeStampas the name for the Time-field.Click Create to add the new index pattern.
Conclusion
The handy tools and explanation in the preceding guide detailed just what to do in order to create a new index pattern for Kibana to connect to Elasticsearch. The terms that have been set here will help bring a new dimension to the mastery of the Elastic suite.


Pilot the ObjectRocket Platform Free!
Try Fully-Managed CockroachDB, Elasticsearch, MongoDB, PostgreSQL (Beta) or Redis.
Get Started